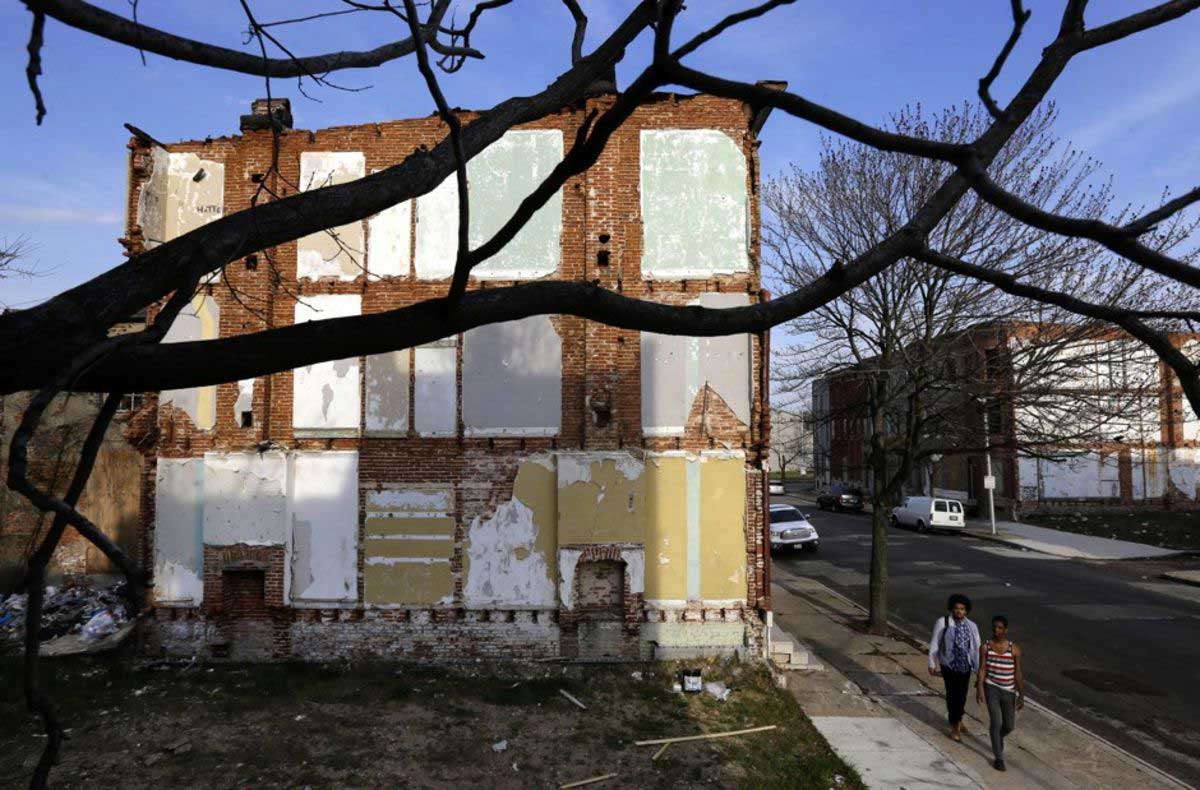
The share of American residents living in economically distressed zip codes stands at 25% percent, according to a study from the advocacy organization Economic Innovation Group (EIG).
More than 50 percent of the 50.5 million Americans living in economically distressed zip codes are people of color, the group’s Distressed Communities Index report found, and many of the gaps between the nation’s black and white households continue to widen since the end of the Covid pandemic. The EIG Distressed Communities Index divides zip codes into the following groupings: prosperous, comfortable, mid-tier, at risk and distressed.
Geographic prosperity in the nation has shifted to states in the Northwest such as Idaho, Montana, Washington and Oregon, according to their latest report. In addition, urban areas have accumulated an increased share of prosperity, and states with large cities benefited from the trend, researchers found.
Distressed communities, on average, have a quarter of their residents living in poverty and 35 percent of their key working-age populations are unemployed.
Sign up to Join the Movement. Everyone can be an investor in a more equitable future.
Share of State Populations Living in Economically Distressed Zip Codes
| Rank | State / Territory | % of Residents Living in Distressed Zip Codes |
| 1 | Mississippi | 45.4% |
| 2 | West Virginia | 43.8% |
| 3 | Louisiana | 39.1% |
| 4 | Alabama | 38.2% |
| 5 | Kentucky | 37.2% |
| 6 | New Mexico | 37.0% |
| 7 | Arkansas | 33.2% |
| 8 | Oklahoma | 31.9% |
| 9 | Rhode Island | 27.0% |
| 10 | Texas | 24.5% |
| 11 | Missouri | 23.0% |
| 12 | South Carolina | 22.5% |
| 13 | Illinois | 22.1% |
| 14 | Tennessee | 21.3% |
| 15 | Georgia | 20.8% |
| 16 | Ohio | 19.2% |
| 17 | Indiana | 18.5% |
| 18 | North Carolina | 17.6% |
| 19 (tie) | Arizona | 16.5% |
| 19 (tie) | Pennsylvania | 16.5% |
| 21 | Michigan | 16.4% |
| 22 | Nevada | 16.2% |
| 23 | Kansas | 15.0% |
| 24 | Virginia | 14.9% |
| 25 | District of Columbia | 14.7% |
| 26 | Connecticut | 13.8% |
| 27 | New York | 11.6% |
| 28 | New Jersey | 11.3% |
| 29 | Florida | 9.6% |
| 30 | Delaware | 8.7% |
| 31 | Montana | 8.3% |
| 32 (tie) | Wisconsin | 8.2% |
| 32 (tie) | Maryland | 8.2% |
| 34 | California | 8.0% |
| 35 | Massachusetts | 7.9% |
| 36 | Alaska | 7.7% |
| 37 | Wyoming | 7.6% |
| 38 | Maine | 7.3% |
| 39 | South Dakota | 7.2% |
| 40 | Iowa | 6.0% |
| 41 (tie) | Colorado | 4.2% |
| 41 (tie) | Oregon | 4.2% |
| 43 (tie) | New Hampshire | 4.1% |
| 43 (tie) | Nebraska | 4.1% |
| 45 | North Dakota | 3.2% |
| 46 | Idaho | 3.0% |
| 47 | Minnesota | 2.9% |
| 48 (tie) | Utah | 2.7% |
| 48 (tie) | Washington | 2.7% |
| 50 | Vermont | 2.0% |
| 51 | Hawaii | 0.6% |
Source: Economic Innovation Group


